This blog post is written by Jan Hoffmann, a student at Manhattan College who was part of one of our NYG&B Labs teams this summer. The team assisted Professor Adam Arenson in his project tracking and visualizing migration patterns of African North Americans prior to, during and after the American Civil War. A portion of the project focused on locating Canadian-born African North Americans in the U.S. Federal Censuses for 1860, 1870 and 1880. His first blog post discussed his approach and showed some of the visualizations he produced.
In my first blog post, I talked about which tools worked out as we visualized this census data.
In this post, I want to focus especially on those first attempts and what didn’t work, as that is also key to our learning experience.
Due to the great availability of historical data on the internet, web scraping seemed like a good way to pull out the data we need. There are two reasons why this is a good way to collect data.
First, it is very fast, once the code is written, and applicable for a big amount of data. Second, and even more important, it’s repeatable. This allows us to run the process over and over again if we need more data or made a mistake.
Chrome DevTools
To find the desired content, one can use Chrome DevTools which are extremely powerful, especially in the “Inspect Element mode.” Combined with R and the httr, rvest, and xml2 package, one can pull content from most kinds of websites.
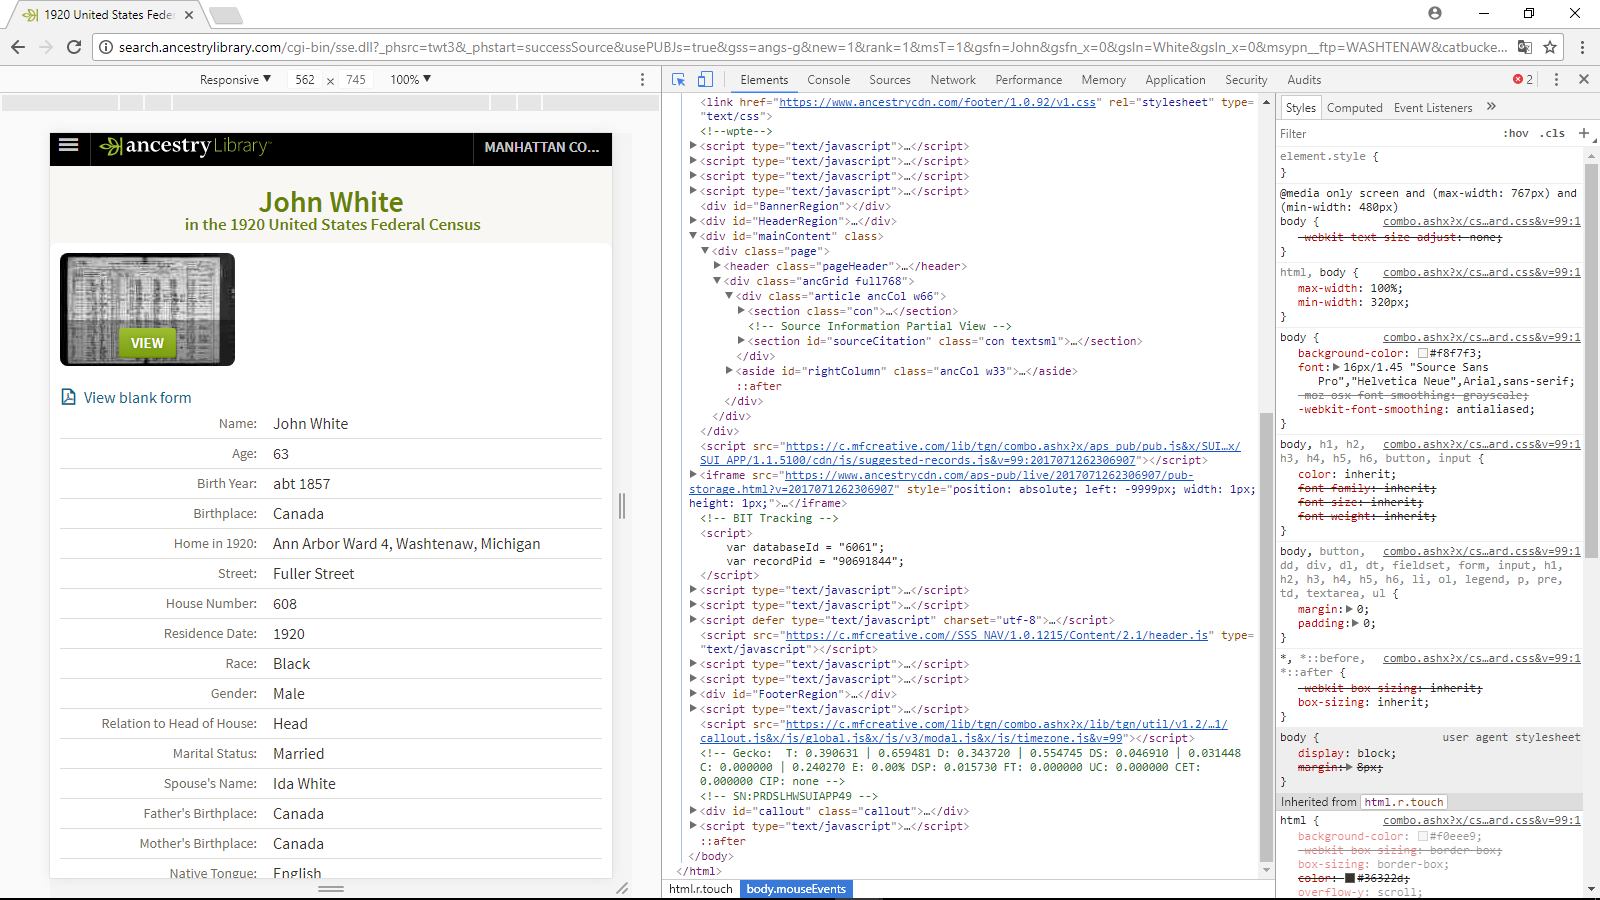
Unfortunately, it was not possible to automate the web scraping process since Ancestry Library, one of our data sources used, does not create pages that will respond to this kind of code scraping.
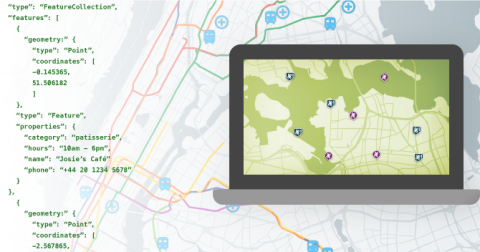
Geo-locations and visualization
With this easy solution off the table, we started pulling the geo-locations and visualizing our data as I described in the first post, which turned out to be a success. In data analytics, as in so much in life, sometimes one just must try before one can tell if it is the right attempt for a problem, and then try a new solution when needed.
To pull the geo-location we used a GoogleMaps API, which is a very convenient way to get latitude-longitude information. However, some technical problems come with that as well.
Firstly, I should mention that Google has a daily limit on location requests, which means that we got cut off once the limit was reached and therefore had to wait 24 hours to continue our work. Secondly, some addresses could not be found.
Over one hundred addresses could not have been located by Google Maps, given the use of town names that are no longer used, or formatting issues. Consequently, we had to take a step back and either fix the address name (e.g. abbreviations) or get a broader county location rather than the exact place.
We decided to go with the first solution as often as possible, since pulling locations on a county level would decrease accuracy as well as the comparability of our analysis.
My advice for all data holders is to think about what to do with the data and how to do it before collecting the data. With historical data, this is not possible, so one must spend a lot of time to fix the formatting. If our dataset would not have contained abbreviations or other for Google undefined addresses, this work could have been done faster.