This blog post is written by Jan Hoffmann, a student at Manhattan College who was part of one of our NYG&B Labs teams this summer. The team assisted Professor Adam Arenson in his project tracking and visualizing migration patterns of African North Americans prior to, during and after the American Civil War. A portion of the project focused on locating Canadian-born African North Americans in the U.S. Federal Censuses for 1860, 1870 and 1880. The project is still a work in progress, but we are excited to have the students share their updates in a series of blog posts over the next month.
As a Manhattan College student majoring in Management and Business Analytics, my summer research with Dr. Adam Arenson, Associate Professor of History, and Dr. Musa Jafar, Associate Professor of Accounting and Computer Information Systems has been on an interesting topic in a completely different area than I was used to.
My goal was to visualize locations, migration routes, and social networks among African North Americans crossing the U.S.-Canada border during and after the American Civil War using RStudio, Excel, and Tableau.
Processing the historical data
I pulled the geolocations of our data frame by using Google Maps API to get the latitude and longitude information of the data. This was the perfect task for me to apply my knowledge from this year’s “Data Mining” course taught by Prof. Jafar, who also assisted and helped me throughout the project.
Given the irregularities in historical data and the need to create a new way to visualize this data, many technical problems occurred that could not have been learned beforehand. We could only find and solve them by doing the work—this is why this research project was such a good experience for me.
Visualizing the data
Once I got the longitude and latitude information, I saved the files in a CSV file before importing them into Tableau to visualize.
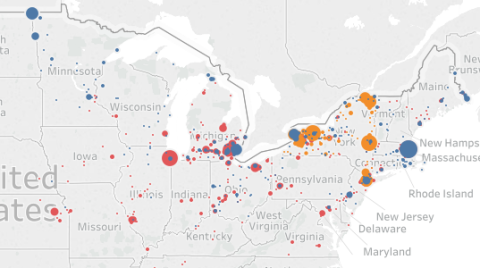
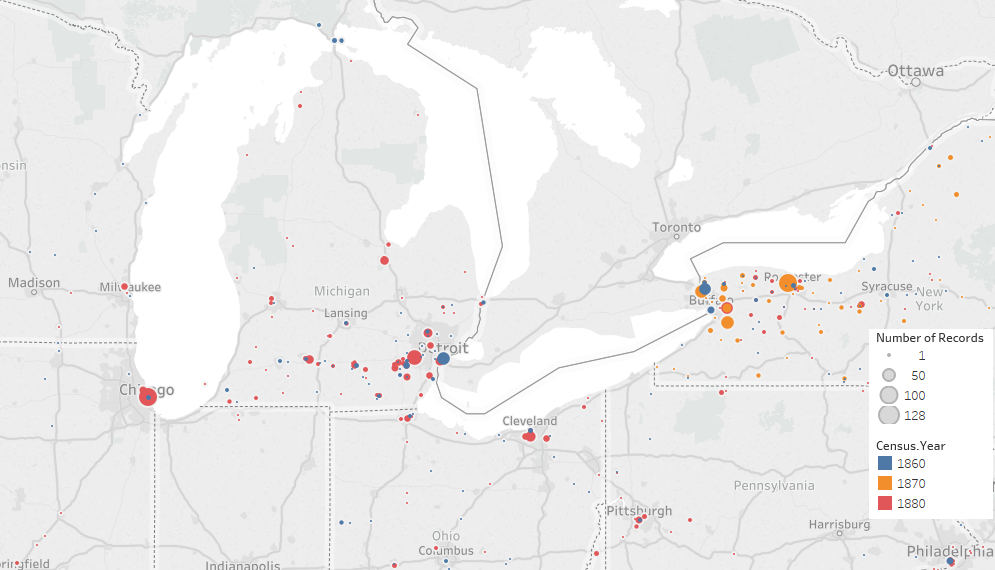
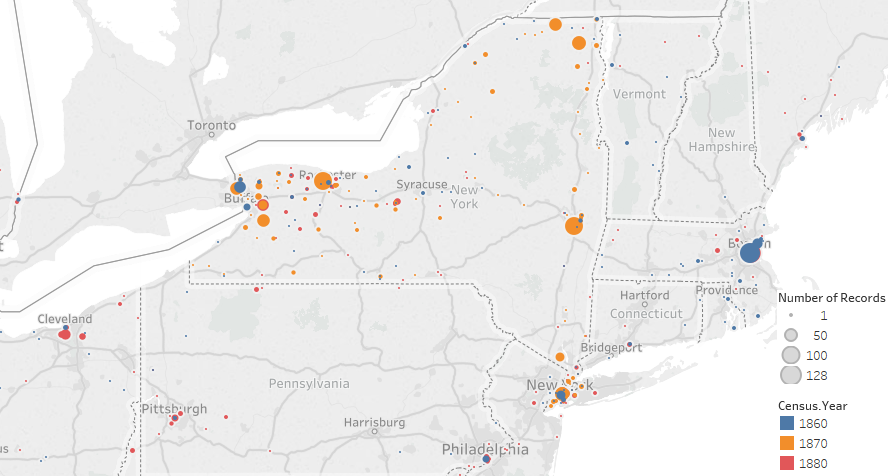
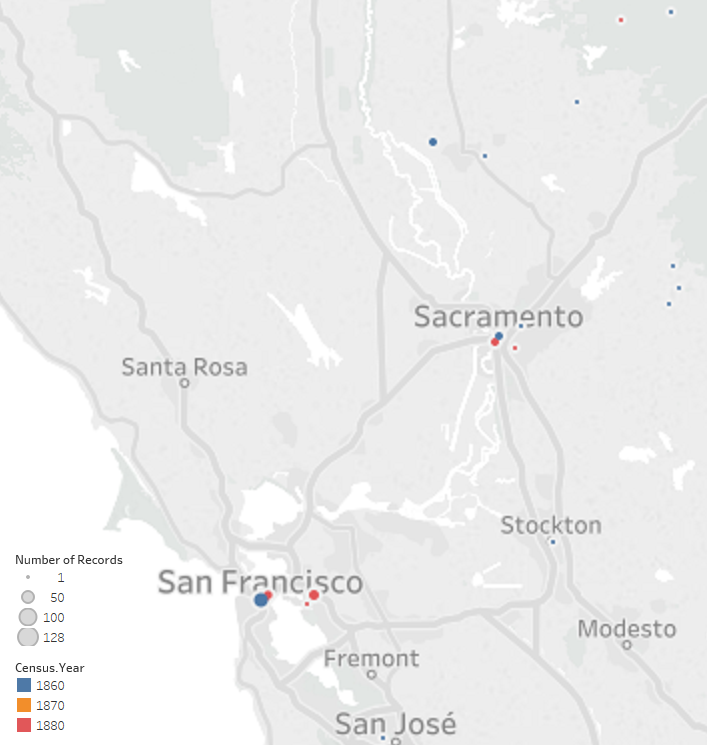
In Tableau, I mapped the Canadian-born individuals we found in the U.S. census, then sorted by census year and counted them by region. This gave us very interesting insights where African North Americans went after crossing the U.S.-Canada border.
Our data frame showed significantly more Canadian-born African Americans moving to California in the 1860 census than in the 1870 census, a result worth exploring more:
Throughout the maps, trends can be seen of people moving to urban areas rather than rural ones, which may reflect the Reconstruction years or this population in particular.
I will leave the interpretation to the experts of this field and I will continue my work focusing on the following census years, tracking these migrations and finding statistically significant differences.
Are you interested in learning more about African-American genealogy? NYG&B members can watch a replay of an amazing talk from Kenyatta Berry that happened at the NYG&B in November 2016. Her presentation, From Virginia to Upstate New York: An African-American Family's Journey to Upstate New York offers another look at a subject closely related to what our Labs team is researching. Our New York Knowledge Base also contains a bibliography for African-American research, and a recent blog article listed some essential resources for African-American research in the NYG&B Record.